Home > Key Stage One > Maths > Statistics > Block Graphs
Summer Holiday Graphs

This maths scheme of work for Key Stage One gets the children to practise using frequency and tally charts and block graphs to organise and present data about some of the special things that can happen during a summer holiday. The class can identify key questions that a block graph can answer about a set of data.

Picnic Foods
Explore and record how to transfer information about some of the special foods that can be eaten on a picnic enjoyed on a family summer holiday from a frequency chart to a block graph
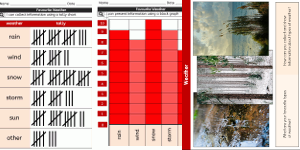
Favourite Weather
Practise recording information about favourite types of weather that might be experienced on a holiday by collecting and presenting information using a tally chart and block graph
-
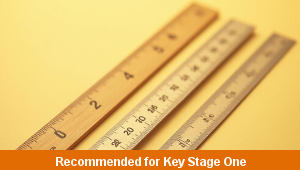
Maths Measurement Assessment
Assess abilities in estimating, measuring and comparing a range of different measurements for length, mass and capacity
-
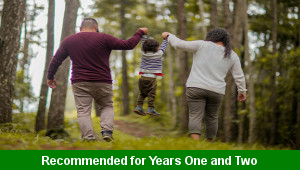
Family Life
Investigate and reflect on some of the special events and experiences that might happen in the life of a family
-

Final Sounds Word Guess
Practise playing some guessing and matching games to identify the spelling and meaning of words with different final sounds
-

Building Reports
Explore how to collect facts and information to work with when composing and presenting non-chronological reports about buildings that can be found in the local area