Weather Data

This computing scheme of work for Key Stage Two gets the children to investigate how to use different forms of technological sensors to record, monitor and present weather information and data. The class can demonstrate how to use charts and graphs to organise data that they have collected about the weather.

Investigate how to use different forms of technological sensors to record, monitor and present weather information and data
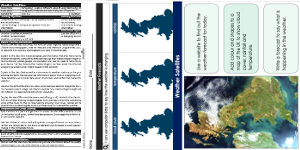
Lesson One : Weather Satellites
Explore different ways of using forms of technology to measure and forecast the weather
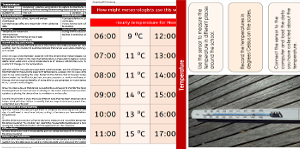
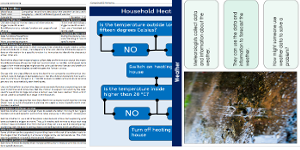
Lesson Two : Temperature
Practise using sensors to capture temperatures in different locations around the school
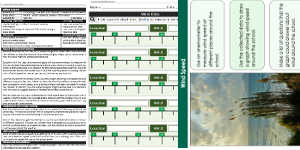
Lesson Three : Wind Speed
Investigate how to use electronic devices to measure wind speed in different locations around the school
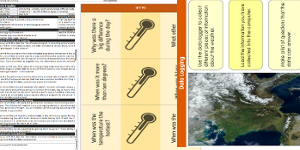
Lesson Four : Data Logging
Collect, record and analyse different sets of data and information about what is happening in the weather
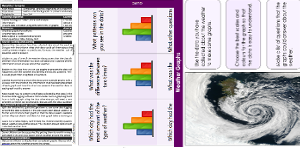
Lesson Five : Weather Graphs
Practise organising and presenting data that has been collected and stored about the weather
Lesson Six : Data Functions
Identify and record how data about the weather can be used for a range of different functions
-
Length Calculations
Practise using number calculations skills for addition, subtraction, division and multiplication when solving problems related to length measurements
-
Maths Calculations Assessment
Assess abilities in solving a range of different number problems for addition and subtraction when working with informal and formal written calculations
-

Determinant Lists
Explain and model how to make lists of objects used and found in different locations to match the correct determinants of a and an
-
English SPAG Assessment
Assess abilities in composing sentences for fiction and non-fiction using the correct spellings, punctuation marks and grammar vocabulary phrases